How to Measure the Impact of Scholarly Work with Research Metrics
Bibliometric data is indispensable when it comes to evaluating the impact of your scientific work. If you're not afraid of facing one or two mathematical formulas, then you can learn how to interpret the most common metrics, such as Impact Factor or CiteScore, here.
This post is part of a series that provides practical information and resources for academic authors and editors.
Numbers, numbers, numbers – many scholars love them, and they are also widely used to measure and analyze scholarly literature. However, they can be a double-edged sword because numerical data can only show so much. Still, taken with a grain of salt and paired with other methods, metrics can be a helpful and powerful tool to measure the impact of published work.
Bibliometrics is a vast field, but as an author or editor, you will most probably draw on several leading publication metrics, like the Journal Impact Factor and the CiteScore to evaluate the impact of your work. Let’s take a closer look at them to give you an overview.
Before we begin, for context, note that the most used traditional research metrics are based on data from the Web of Science and SCOPUS databases.
1. Web of Science
1.1 Journal Impact Factor
1.2 Eigenfactor
1.3 Immediacy Index
2. SCOPUS
2.1 CiteScore
2.2 Source Normalized Impact per Paper (SNIP)
2.3 SCImago Journal Rank (SJR)
3. Other
3.1 Altmetrics
3.2 The h-index
1. Web of Science
1.1 Journal Impact Factor
The Journal Impact Factor (JIF), or simply Impact Factor (IF), is probably the most well-known journal metric. In the early 1960s, the term was first coined by Eugene Garfield, the founder of the Institute for Scientific Information. Today, the company Clarivate calculates and provides the Journal Impact Factor based on citation data from their own, paid-access database Web of Science.
To be included in the Web of Science, a journal must demonstrate compliance with a number of fixed criteria (learn more in our blog post “How to Get and Grow an Impact Factor”). However, only a subset of Web of Science journals currently receives a Journal Impact Factor – those indexed in the Journal Citation Reports (JCR).
Beginning with the 2023 JCR release in June, Journal Impact Factors will be given to journals that are included in the Science Citation Index Expanded (SCIE), the Social Science Citation Index (SSCI), the Humanities Citation Index (AHCI) and the multidisciplinary Emerging Sources Citation Index (ESCI).
The Journal Impact Factor is updated once a year and can usually be found on a journal’s website.
Before you start checking out specific Journal Impact Factors, let’s make sure you understand the underlying calculation: Generally said, the Journal Impact Factor measures the average number of times an article in a particular journal is cited in a particular year. It is the ratio between citations and citable items published in the preceding two or five years. When talking about the Journal Impact Factor, it is usually the two-year Journal Impact Factor that is meant.
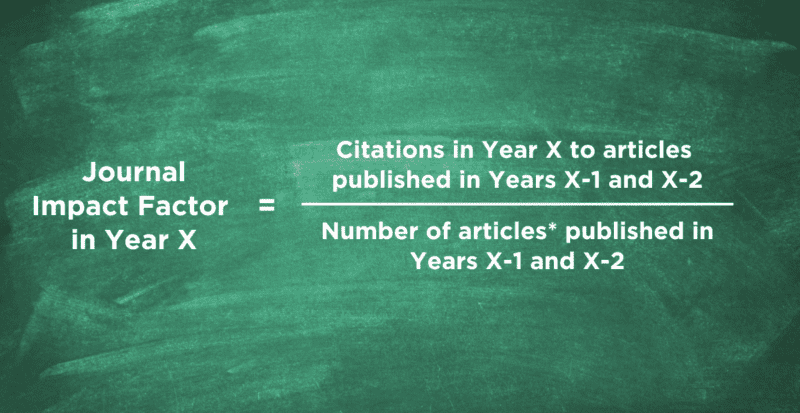
An example: If a journal received a two-year Journal Impact Factor of 3 in the year 2021, it means that articles published in the years 2019 and 2020 have been cited on average three times in 2021. However, it’s important to keep in mind that this is only an average value. Some highly influential articles will be cited much more often, while others will receive less or even no citations. This is one reason to look beyond the Journal Impact Factor when trying to find the right journal.
Are you looking for the right place to publish your work? Find out what we do at De Gruyter to make your journal article or book more discoverable and bolster citations.
1.2 Eigenfactor
The Eigenfactor was first presented in 2006 as an alternative to the Journal Impact Factor. The creators’ idea was to create a “more sophisticated way of looking at citation data” by weighing citations differently, depending on the prestige of the contributing journal.
Clarivate’ Eigenfactor concerns only journals that are part of the Journal Citation Reports. It measures how often a journal has been cited in the past five years, while eliminating journal self-citations. Citations by highly cited journals influence the score more than those by lower-tier journals.
Eigenfactor scores are scaled so that the sum of the Eigenfactor scores of all journals listed in the Journal Citation Reports is 100.
1.3 Immediacy Index
The Immediacy Index reflects the average number of times an article is cited in the same calendar year it is published. It indicates how quickly articles in a journal are cited and, as such, helps to measure how topical and urgent the content is. It is calculated by dividing the number of citations to articles published in a given year by the number of articles published in that year.
Journals, which publish infrequently or later in the year, will have lower Immediacy Index values. So will journals that deal with research questions that unfold rather slowly.
2. SCOPUS
2.1 CiteScore
The CiteScore (CS) of a journal is based on citations in the SCOPUS database, which was launched in 2004 and is owned by the academic publishing company Elsevier. The metric itself has been around since 2017 and has become a serious competitor to the Journal Impact Factor.
Similar to the Web of Science database, a journal must comply with a number of criteria to be included in SCOPUS.
Like the Journal Impact Factor, the CiteScore measures how often an article in a particular journal is cited in a specific year on average. However, the CiteScore looks at a four-year citation window, claiming it to be a good compromise for fast- and slow-moving fields. It is calculated by forming the ratio between citations to articles published in the last four years (including the CiteScore year) and the number of articles published in those same four years.
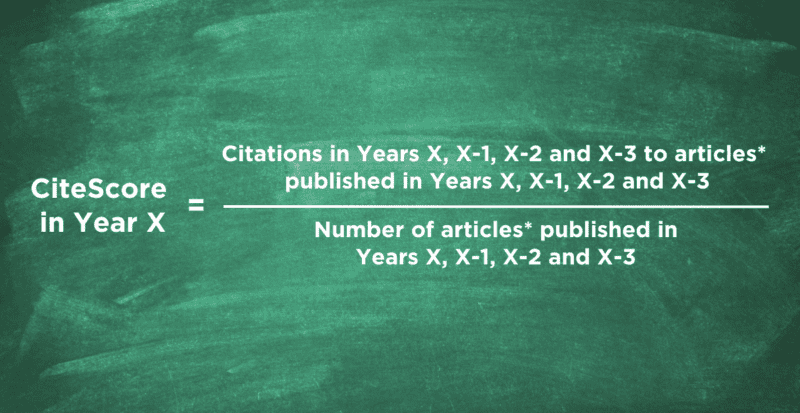
An example: If a journal received a CiteScore of 4 in the year 2021, it means that articles published in the years 2018-2021 have been cited on average four times in these same years (2018-2021). However, as with the Journal Impact Factor, it’s important to keep in mind that this is only an average value.
2.2 Source Normalized Impact per Paper (SNIP)
The Source Normalized Impact per Paper (SNIP) weights citations differently based on the total number of citations in a subject field. That means it contextualizes, or “balances”, citation impact. In subject areas with low citation frequencies, the impact of a single citation is rated higher than in subject areas where citations are more likely – and vice versa.
Subject fields with typically lower citation frequencies are, for example, mathematics, social sciences and the humanities. Subject fields with higher citation frequencies are usually among the STM disciplines (science, technology and medicine).
2.3 SCImago Journal Rank (SJR)
The SCImago Journal Rank, based on the SCOPUS database, is similar to the Eigenfactor (see 1.2) in measuring the scientific influence of a scholarly journal. It takes into account the number of citations received by a journal as well as the prestige of the journals from which the citations originate.
Contrary to the Eigenfactor, the SJR does not eliminate self-citations, however, they are limited to one third of the total citations. Furthermore, the SJR looks at a three-year citation window instead of five.
3. Other
3.1 Altmetrics
Alternative metrics – also called altmetrics – are becoming increasingly popular as an addition to traditional bibliometric data. Instead of citations in peer-reviewed journals they capture social media posts, blog entries, news articles and other online mentions to indicate scientific impact.
Interestingly, studies have shown that scientific relevance comes in many forms and that bibliometrics and altmetrics are not separate systems but interconnected. You can learn more about this topic in our blog post “What Are Altmetrics and Why Do We Need Them?” by Dirk Tunger.
3.2 The h-index
The h-index (named after its inventor Jorge E. Hirsch) is an author-level metric, which indicates the academic impact of a researcher based on quantity and quality of their output. It is calculated by counting the number of publications by an author that have been cited by others at least as often. For example, a scholar with an h-index of 5 has published 5 papers, each of which has been cited at least 5 times.
SCOPUS, Web of Science as well as Google Scholar and other citation databases provide calculations of the h-index. It is frequently used in the assessment of job candidates for academic positions as well as the allocation of research grants. If you want to learn more about the index, check out our blog post “How to Improve Your H-Index” by Witold Kienc.
Find more tips for publishing and promoting your work here

[Title image by fizkes/iStock/Getty Images Plus]